
In automotive harness manufacturing, terminal crimping serves as a core process that determines the electrical safety of complete vehicles. The crimping quality between terminals and wires directly affects contact resistance and tensile strength. Once defects such as false crimping, missing wire strands, over‑crimping or under‑crimping occur, heating and circuit breakage may easily take place under vehicle vibration and alternating high‑low‑temperature working conditions, bringing potential safety hazards to the whole vehicle.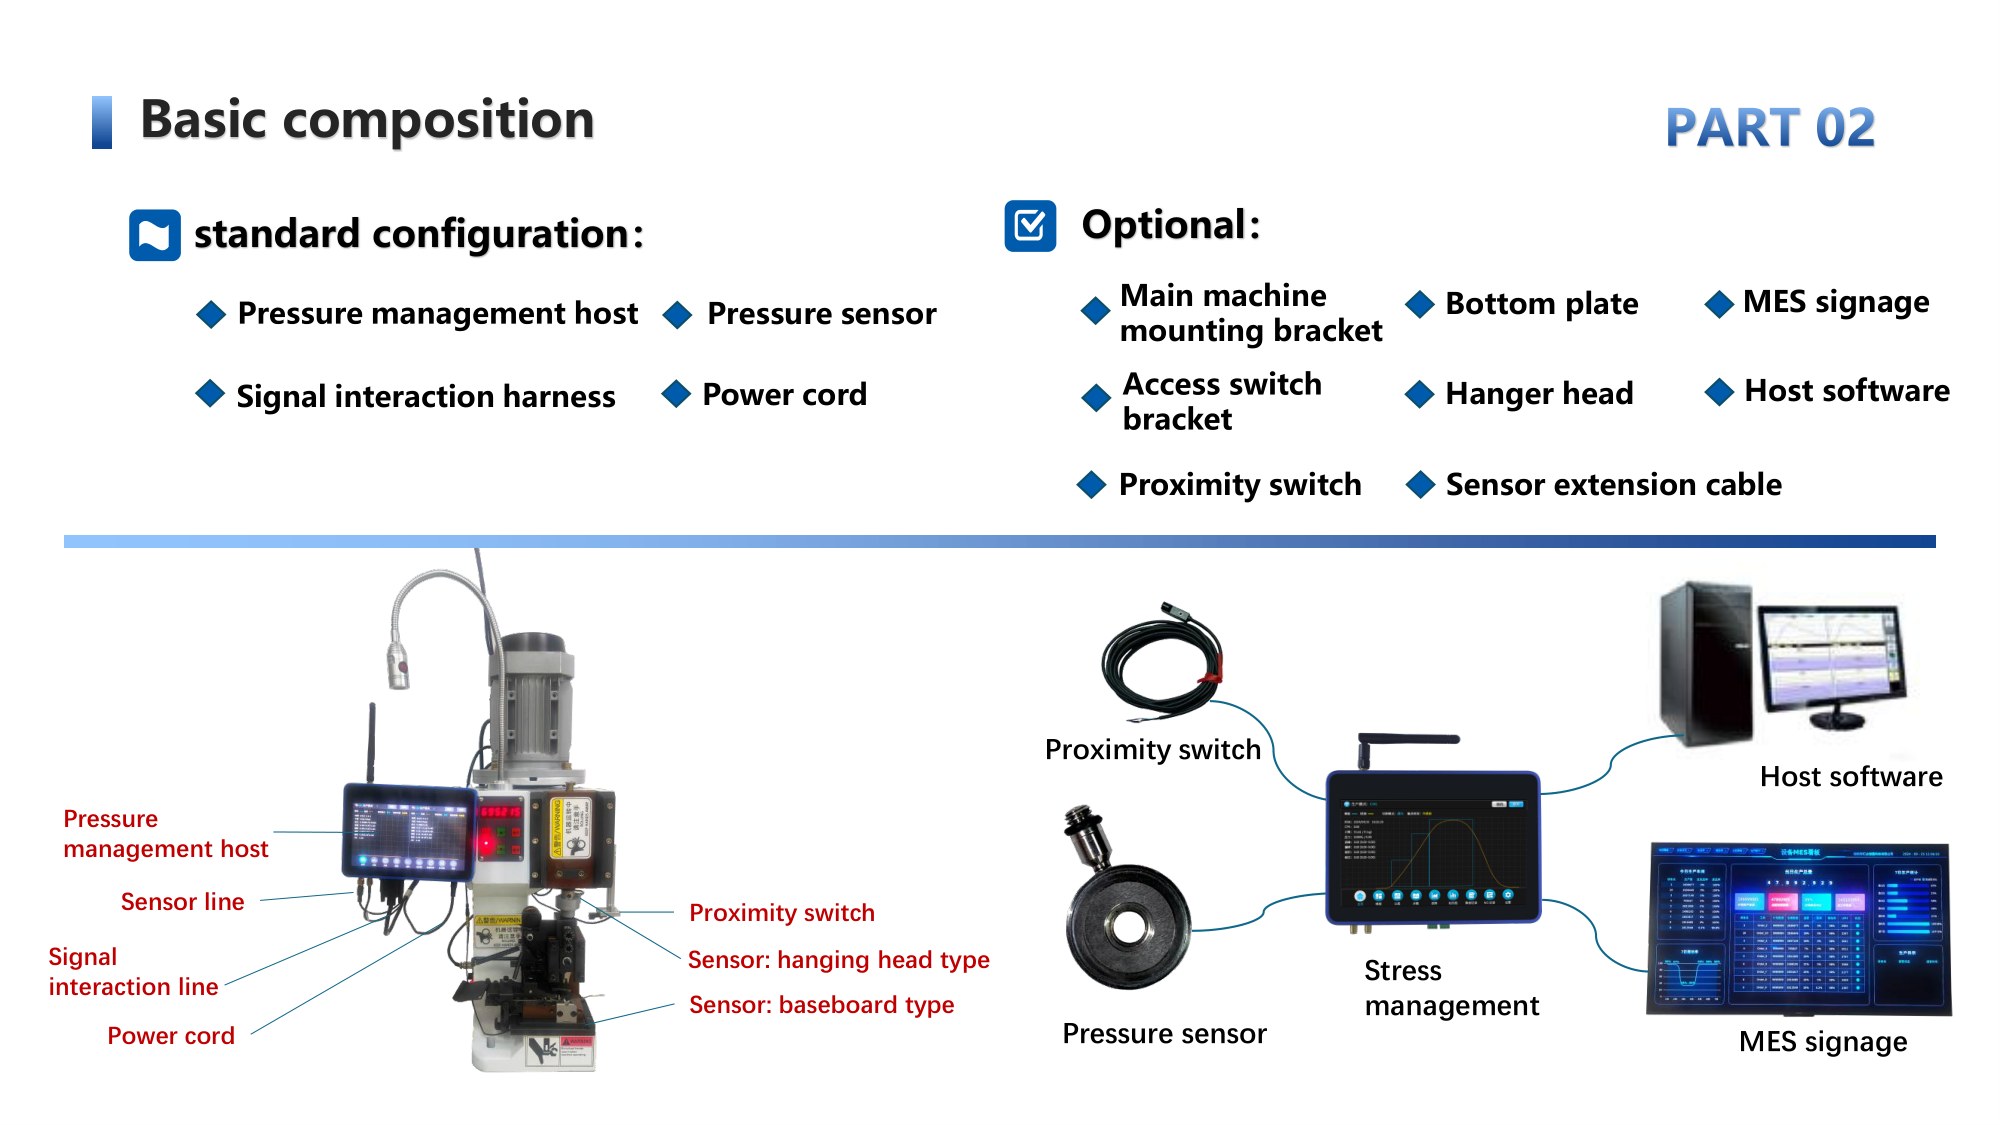
Traditionally, quality control relies on initial‑sample tensile tests, periodic sampling and visual inspection. These methods are essentially post‑verification approaches. Faced with hidden risks including progressive die wear, incoming material fluctuation and equipment parameter drift, conventional solutions struggle to block mass latent defects. The Crimping Force Monitor (CFM) upgrades quality control from “post‑process sampling inspection” to “100% in‑line process prevention”, and has become an important tool for harness manufacturers to improve process stability.
Working Principle of Crimping Force Monitor
Terminal crimping refers to the process where the die presses down to force plastic deformation of copper terminals and wire conductors, generating a continuous pressure‑time waveform throughout the crimping cycle.
Equipped with high‑precision pressure sensors, the CFM collects force signals of each crimp at millisecond‑level sampling rate. Standard template waveforms are generated by processing data from multiple qualified good samples. During mass production, each actual crimp waveform is algorithm‑compared against the template. The whole crimping procedure is divided into three phases S1, S2 and S3 for segmented analysis:
- S1 (Crimping start phase): The terminal bends and fits the die, reflecting the initial forming status of terminals.
– S2 (Compression forming phase): Crimp height keeps decreasing while wire cores are gradually squeezed and compressed.
– S3 (Peak‑force phase): The die reaches bottom dead centre to complete full crimping and rebounds to release pressure.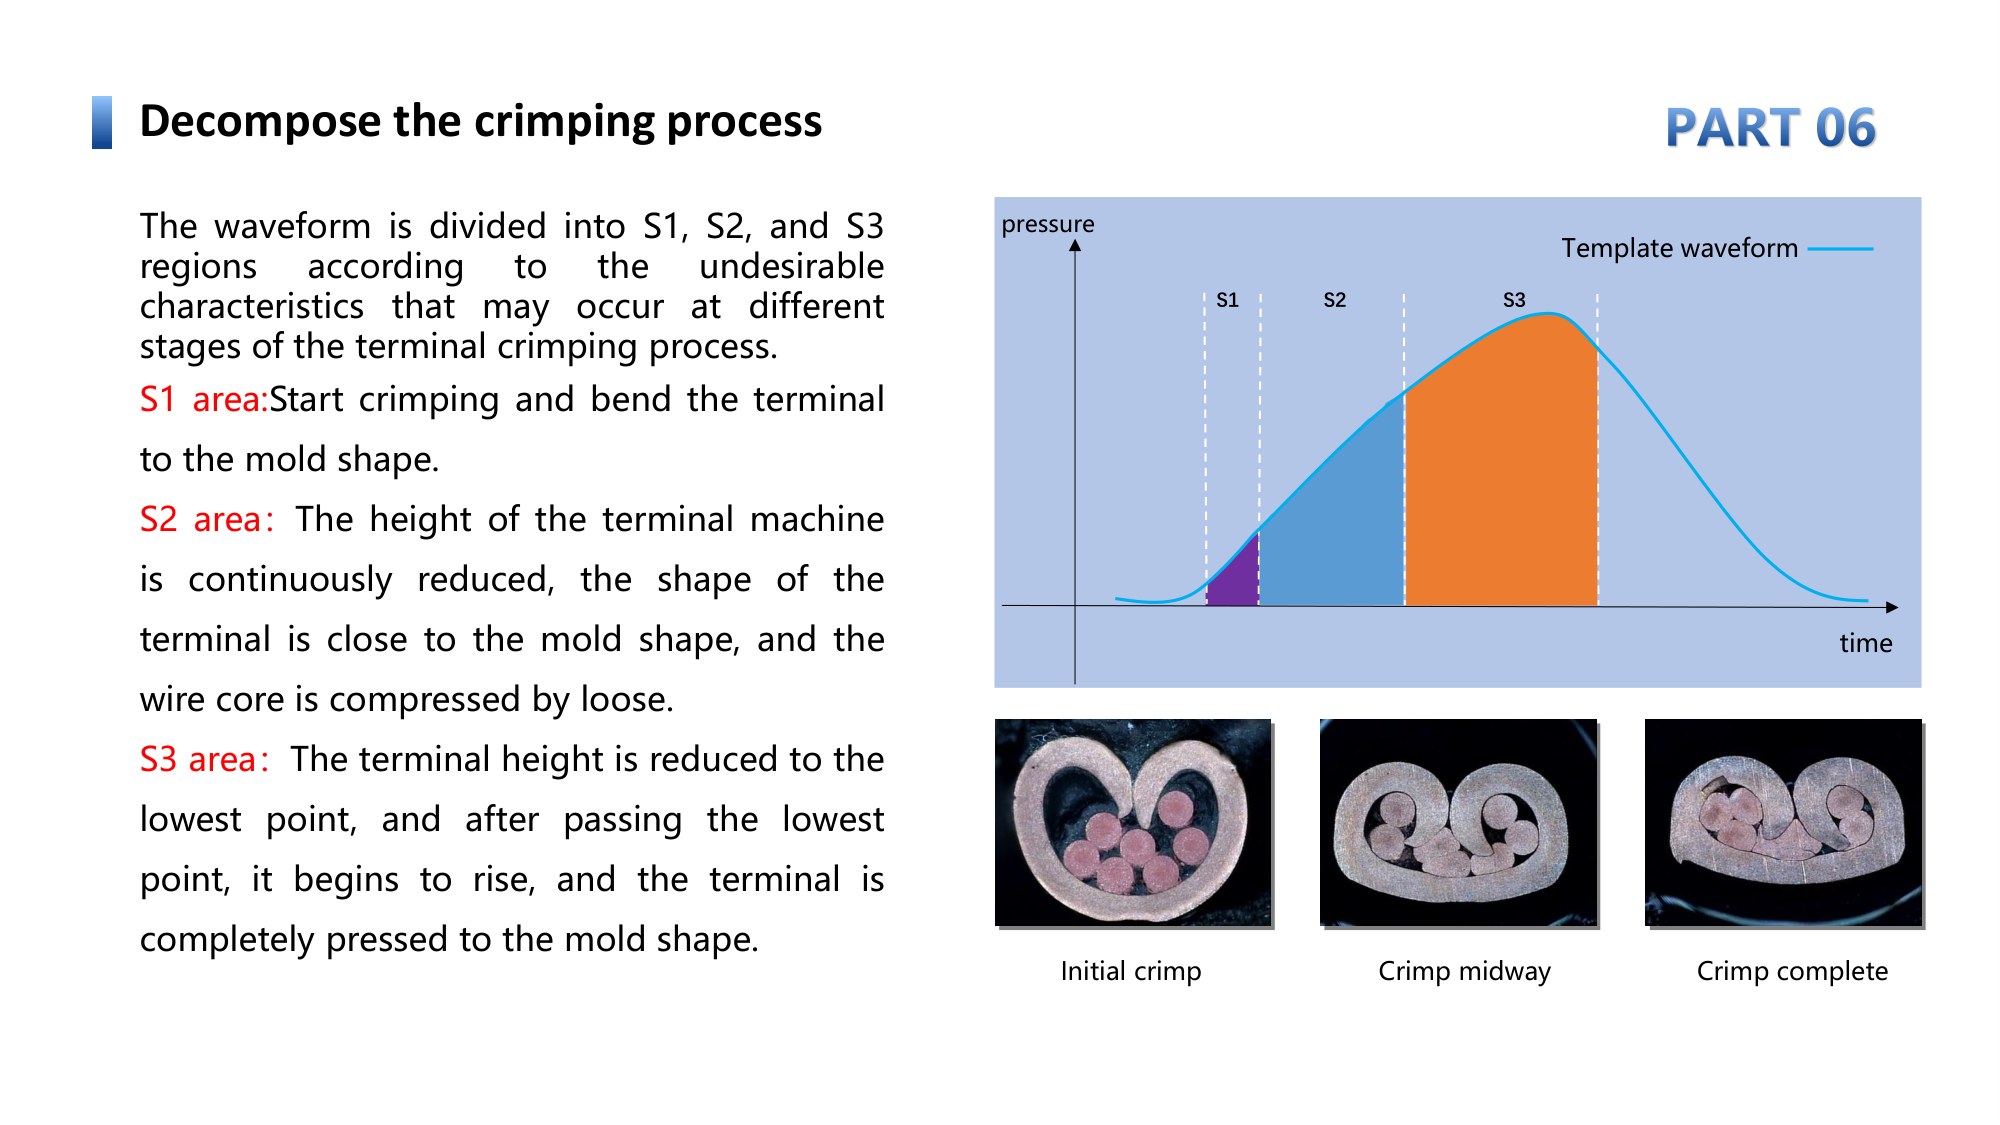
The system calculates the percentage difference between measured waveforms and template waveforms. An NG alarm will be triggered immediately once the value exceeds preset tolerance thresholds to block defective products in real‑time. Instead of judging merely by a single peak‑force value, the system compares the full waveform curve, which helps detect latent internal defects even when crimp height appears acceptable.
Detectable Common Crimping Defects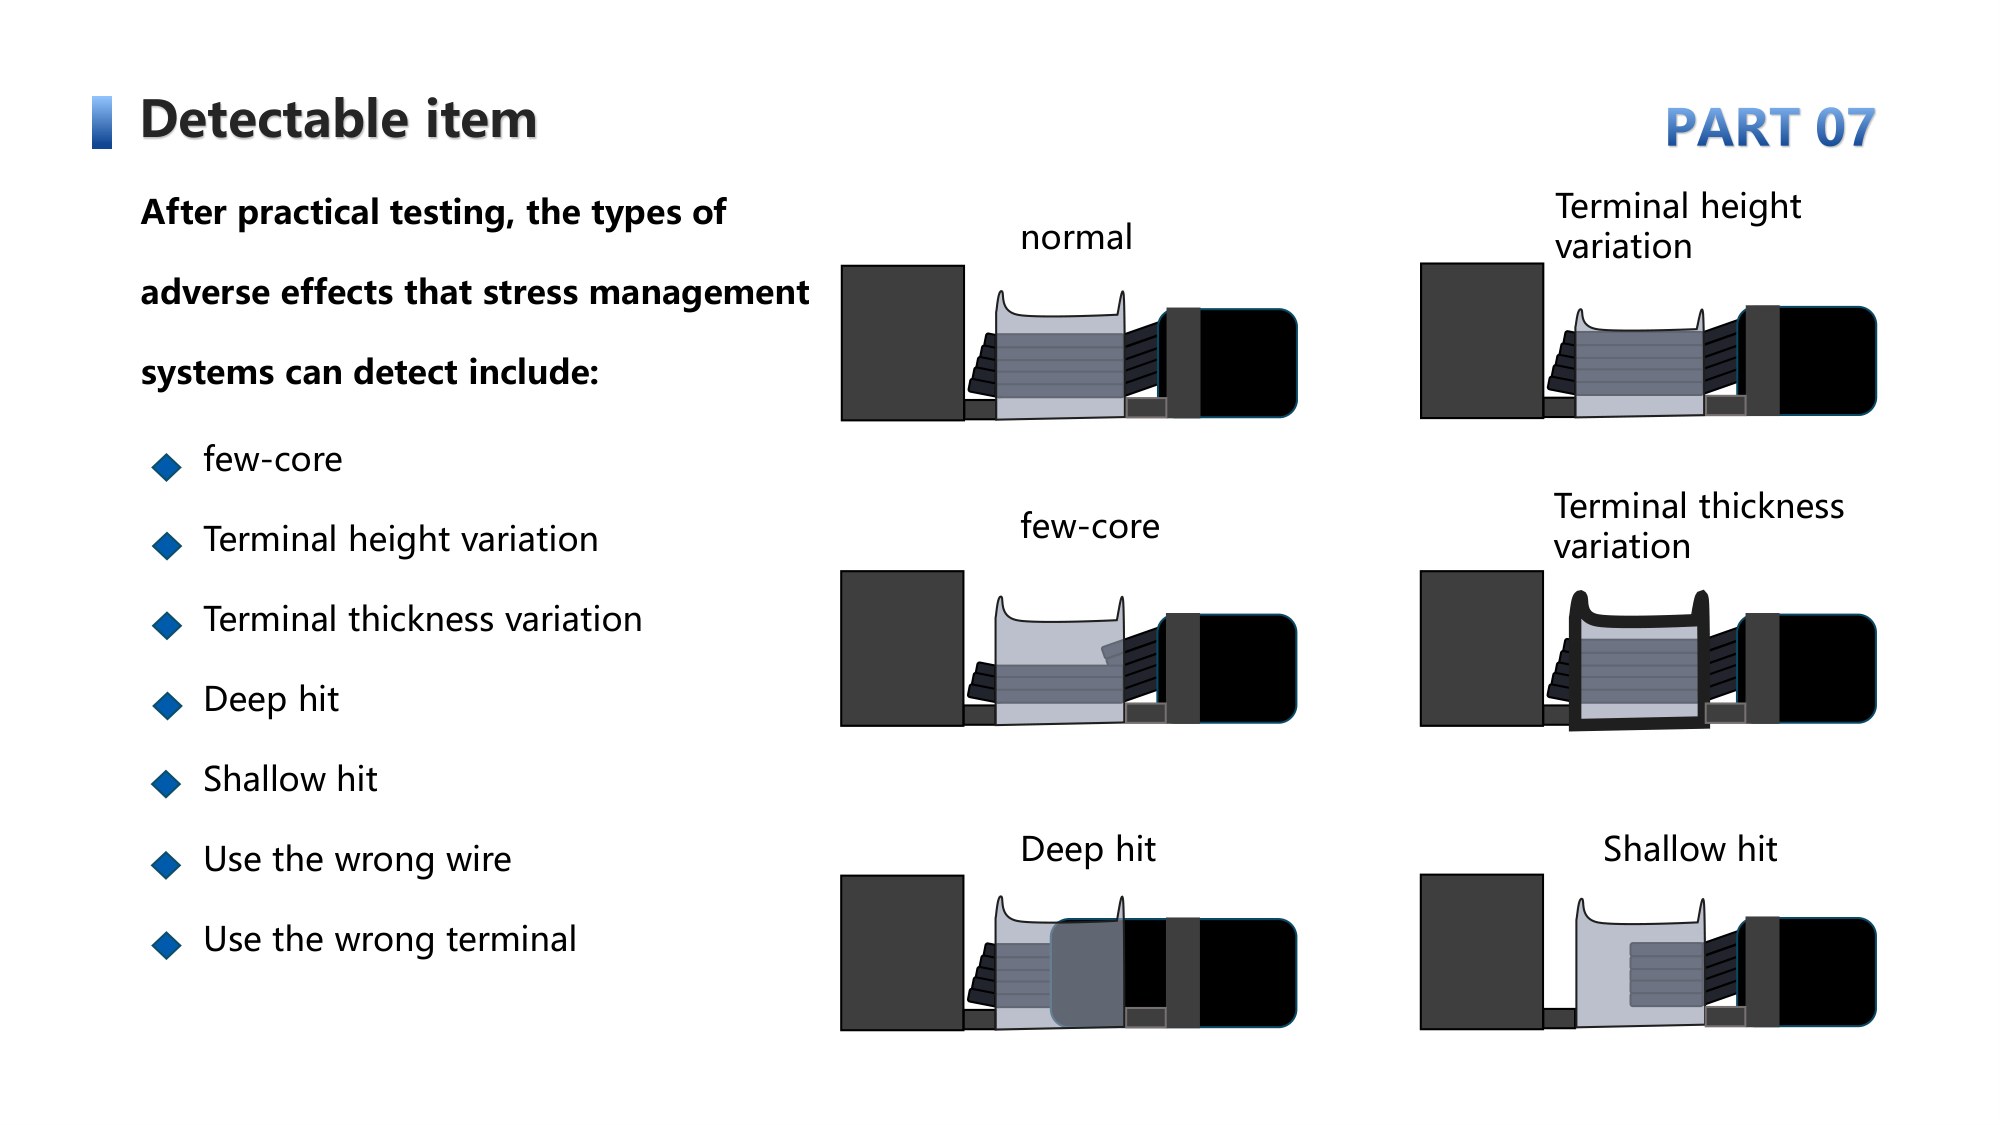
The crimping force monitor identifies various process abnormalities hardly spotted by naked‑eye observation or regular sampling, including missing copper strands, over‑crimping / under‑crimping, crimp‑height deviation, mismatched terminals or cables, insulation trapped into conductor crimp zone, wear or jamming of dies and blades, inconsistent thickness and material properties of incoming terminals.
It should be noted that the crimping force monitor is not an omnipotent solution. Waveform readings can be interfered by terminal machine vibration, loose dies, inconsistent twist tension of wires and unstable incoming materials. On‑site mechanical maintenance and consistent incoming‑material quality are required to achieve optimal detection performance.
Headroom Ratio: Core Indicator for Detection Sensitivity
Many manufacturers encounter cases where certain defects cannot be detected, which is closely related to the **Headroom Ratio**.
Formula: Headroom Ratio = (Good‑product peak force − Air‑crimp peak force) ÷ Good‑product peak force ×100%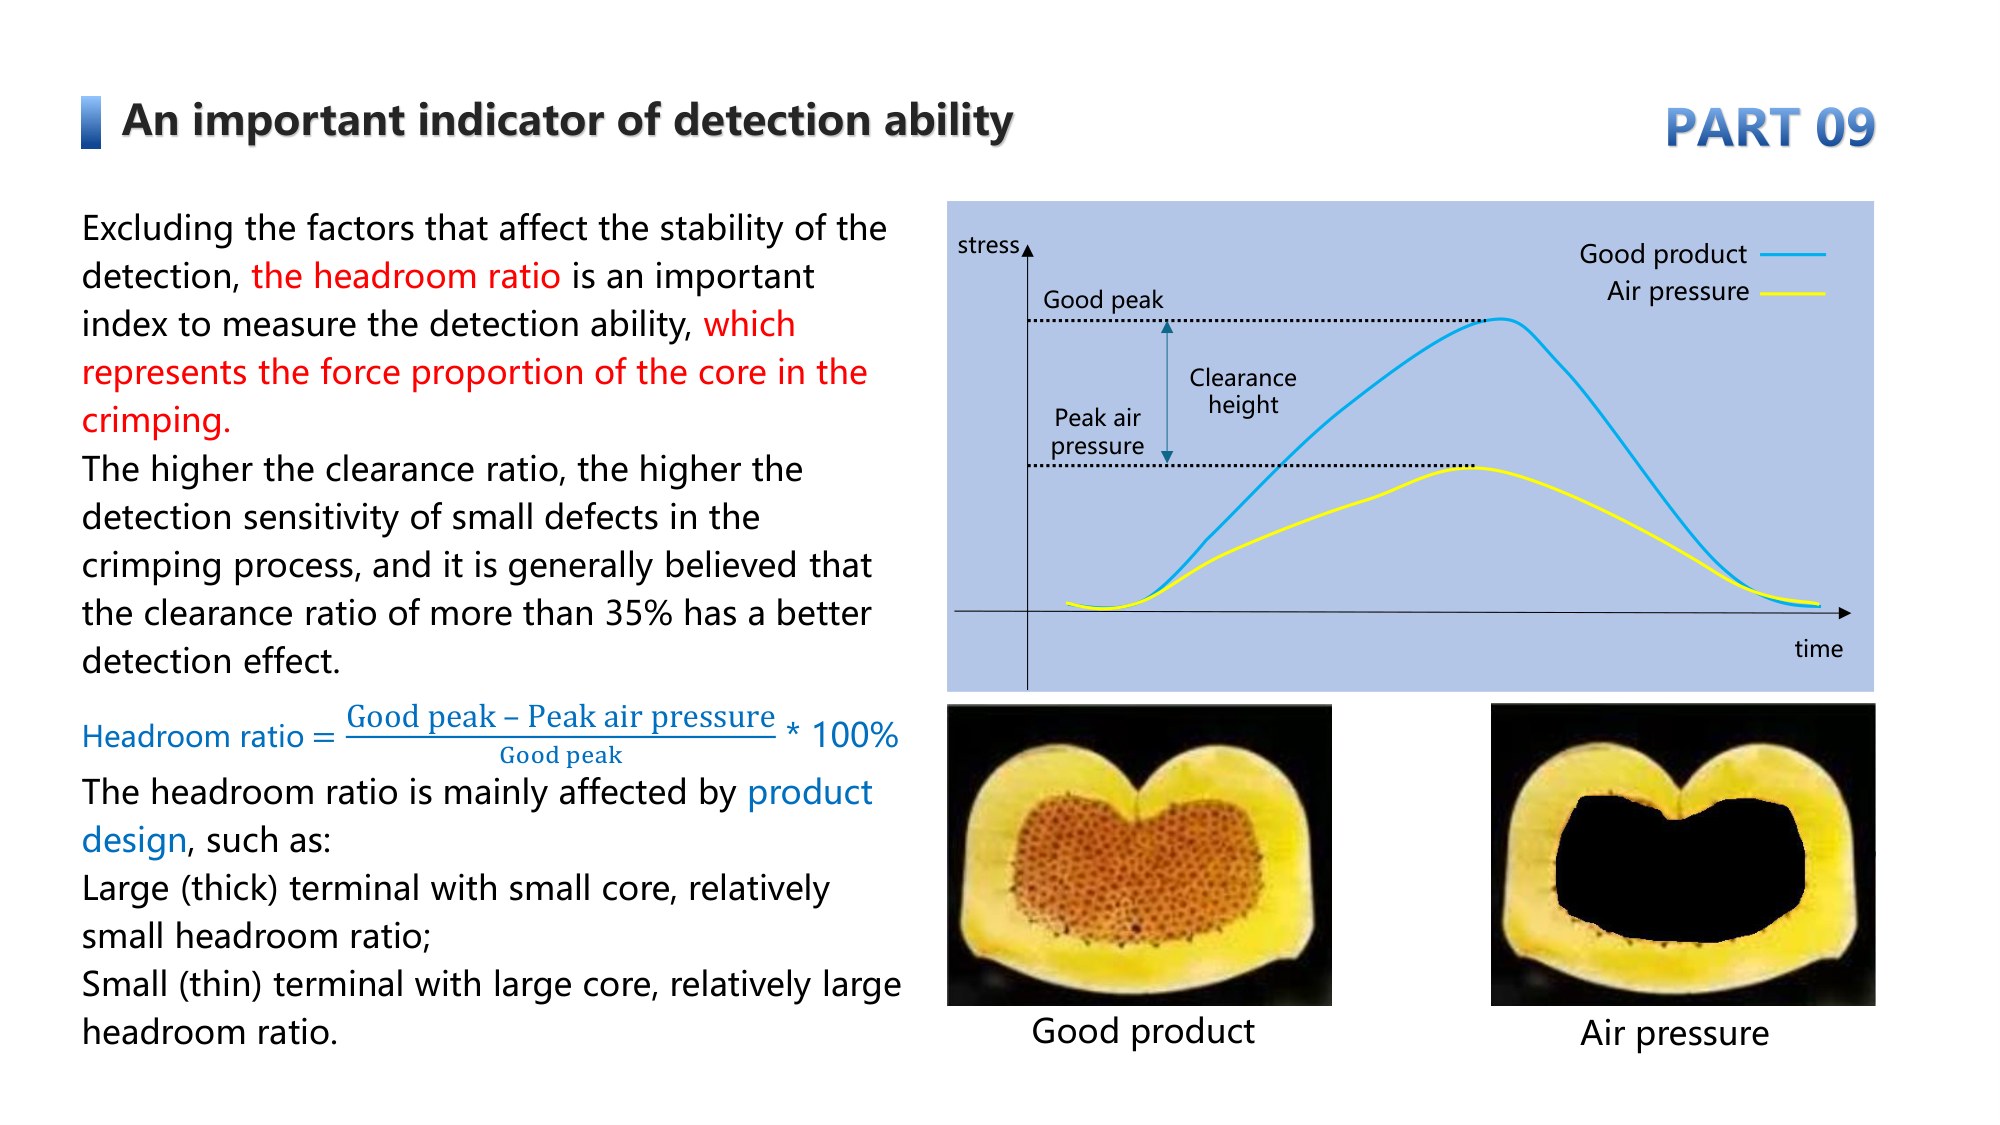
Headroom Ratio represents the force contribution proportion of wires during crimping. Industrial practice proves that a headroom ratio above 35% delivers excellent sensitivity towards minor crimping defects. For applications with thick terminals paired with small‑gauge wires, the headroom ratio will drop and defect‑detection capability will decrease accordingly. This is an objective limitation derived from product structure and shall be evaluated during product selection and process validation.
Standard Implementation Workflow: From Commissioning to Mass Production
Full deployment of a crimping force monitor covers five key steps: sensor installation, template teaching, tolerance configuration, production‑time monitoring and data traceability.
Sensor Installation: Two mounting options are available: hanging‑head type and baseboard type. Trigger modes include proximity‑switch trigger and automatic pressure‑threshold trigger. The system can be retrofitted onto new or existing terminal crimping machines with low implementation barriers.
Template Teaching & Sampling: Multiple confirmed good parts are sampled automatically. The system synthesizes a standard template curve as the judgement benchmark for mass production.
Tolerance Setting: The auto‑tolerance function calculates upper and lower tolerance ranges based on good‑sample data. Smaller gear values mean stricter criteria. After tolerance parameters are configured, manual simulation of various defect scenarios is mandatory to validate alarm logic before formal production launch.
In‑line Production Monitoring: Real‑time waveform comparison is performed during production. OK / NG relay outputs link to equipment alarm or machine stop. Trend charts and histograms visualize batch production fluctuation. Cpk process‑capability statistics are supported to assess crimping‑process stability.
Data Logging & Traceability: Full detection records and complete NG comparison waveforms are stored. Data can be exported in CSV format with order number and equipment number embedded for production review and root‑cause analysis. For mixed‑model production, multiple templates can be saved per channel. Three template‑switching modes are supported: Modbus‑TCP communication switching, IO signal switching, and automatic switching by production count, catering to frequent product change‑over in harness workshops.
Supported by workshop digital transformation, the WiFi‑enabled crimping force monitor can connect to MES dashboards for real‑time upload of production volume, yield rate and waveform data. It connects field‑level equipment with upper‑management systems and eliminates isolated data silos.
Rational Positioning: Complementary Tool Rather Than Substitute
A common misconception in the industry is that crimping‑force monitors can replace tensile tests and cross‑section analysis. In fact, the crimping force monitor serves as a process‑monitoring tool and **cannot replace initial‑sample tensile testing, terminal cross‑section analysis or visual inspection**.
Tensile tests and cross‑section analysis verify the final physical performance of finished products. The crimping‑force monitor focuses on mass‑production procedures to capture process drift and prevent mass‑defect outflow. Combined application builds a complete quality‑protection framework: *Initial‑sample validation + 100% in‑line process monitoring + periodic re‑inspection*.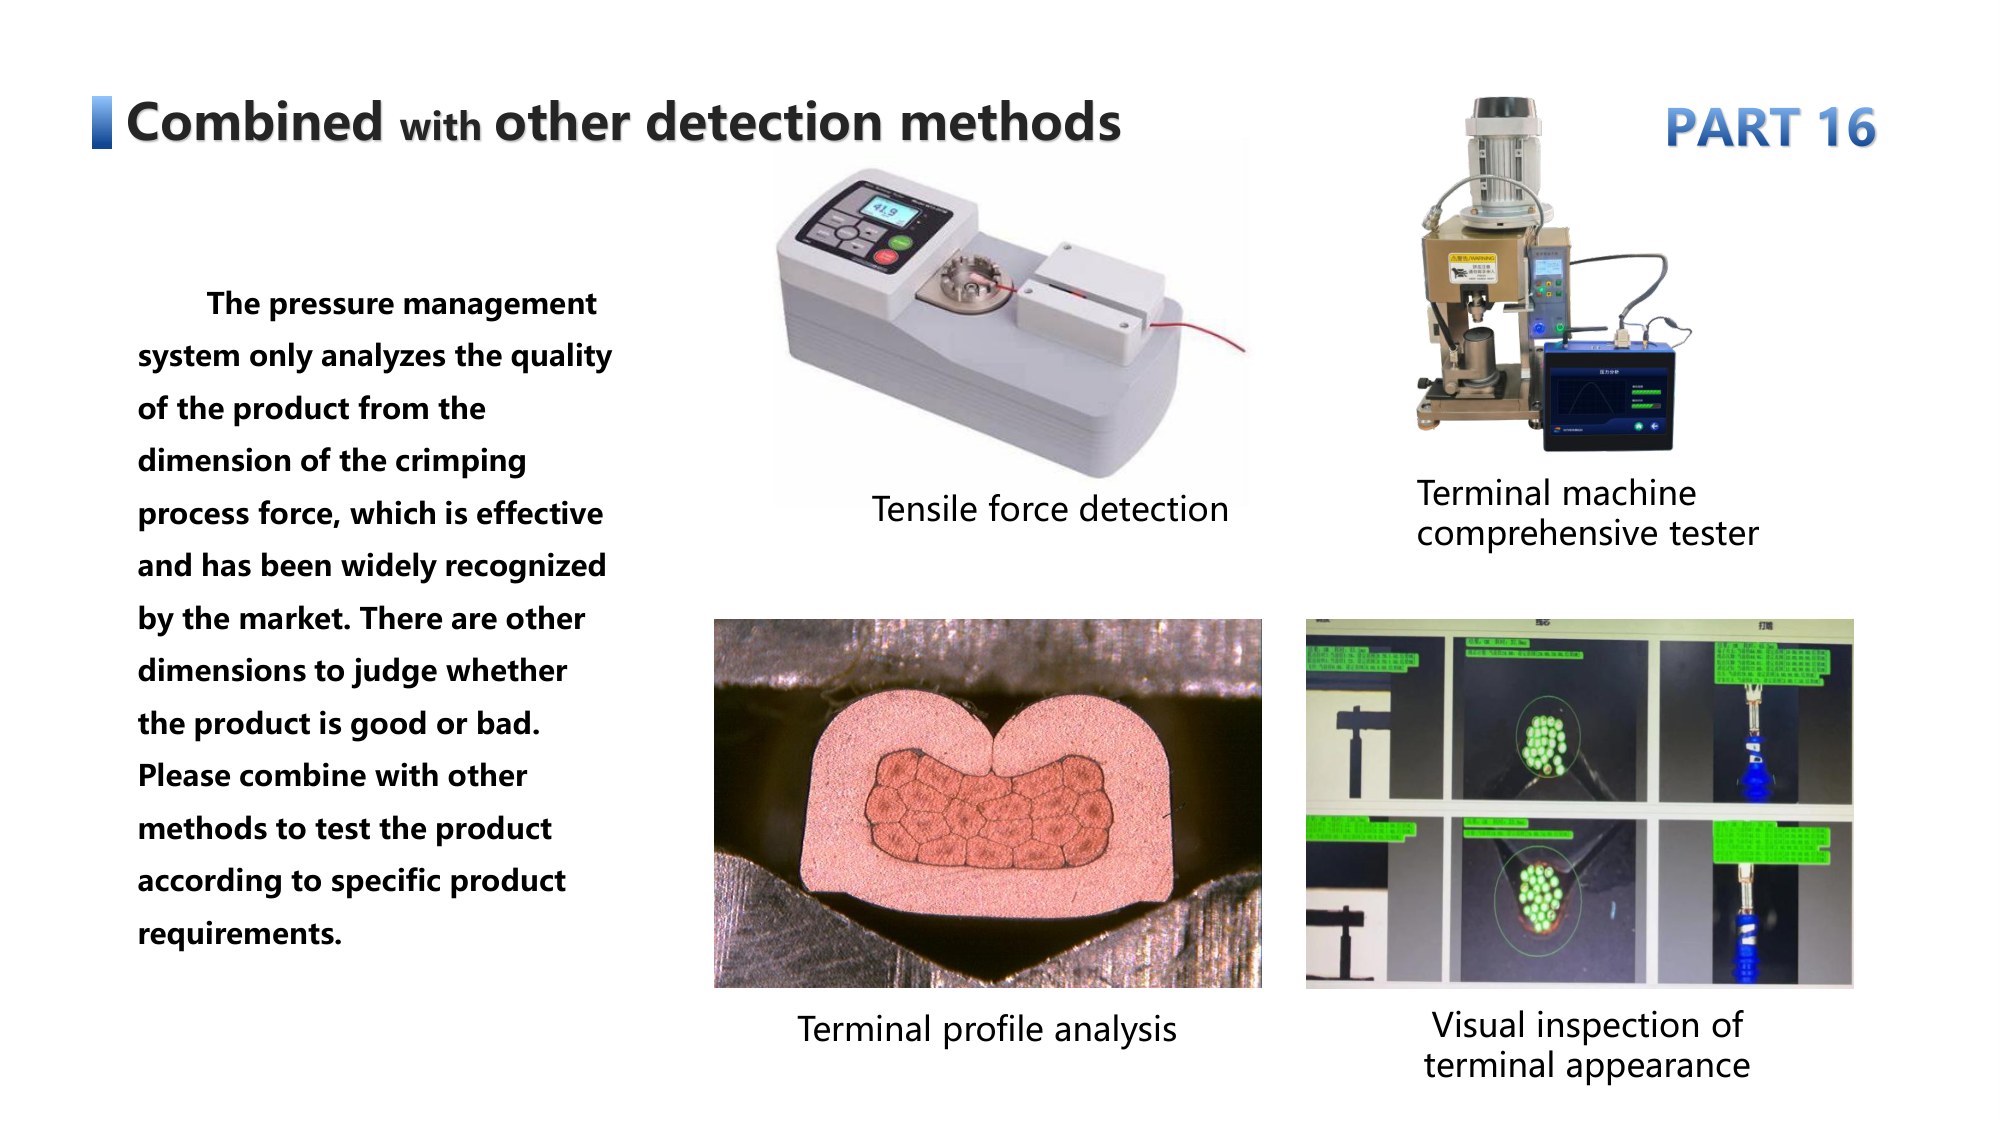
Industry Trend: Harness Quality Control Enters Data‑Driven Era
Driven by new‑energy and intelligent connected vehicles, higher reliability requirements are raised for automotive wiring harnesses. Traditional experience‑driven quality control fails to adapt to high‑mix low‑volume mixed‑line production scenarios. Wide adoption of crimping‑force monitors pushes harness manufacturing to shift from “experience‑based setup” toward data‑driven process quality management.
For harness manufacturers, the value of crimping‑force monitors goes beyond defect interception. It converts invisible internal crimping status into visual waveforms and quantifiable process indicators, shifting from post‑failure rework to early risk warning. It cuts scrap and rework costs and retains complete production records to support high‑quality product delivery.
Want to add 100% in-line crimp monitoring to your harness line? Contact SANAO for the CFM specification sheet and a live demo with your own terminals.
Post time: Nov-18-2026